



I find 3D skin analysis generally beats traditional methods for accuracy, with 95% test-retest reliability and over 80% correlation with professional assessments in studies. A human eye brings subjective judgment to every assessment. Digital imaging brings objective data instead. You can trust 3D skin analysis for more precise, consistent, and comprehensive results. Traditional methods still provide value for quick checks or when advanced technology is unavailable. Can a trained eye really compete with a digital scan?
Key Takeaways
●3D skin analysis is more accurate than traditional methods. It finds acne and melasma with 89–95% accuracy. Traditional methods only reach 78–85%.
●3D scans give consistent results every time. They have 95% test-retest reliability. Traditional analysis varies with lighting, fatigue, and practitioner skill.
●3D skin analysis detects hidden damage below the skin. It uses UV and polarized light to see sun damage and early aging. Your eyes cannot see these problems yet.
●3D devices sometimes give false alarms. About 31% of flagged lesions are benign. Always combine digital scans with a dermatologist’s expertise.
●3D skin analysis is best for tracking changes over time. It provides objective numbers for wrinkles, redness, and pores. Traditional methods are still useful for quick checks.
What Is 3D Skin Analysis and Traditional Analysis?
How Traditional Skin Analysis Works
Traditional skin analysis relies on what a practitioner can see and feel. A dermatologist or esthetician examines your skin under a magnifying lamp, palpates areas of concern, and records observations. This approach depends heavily on subjective interpretation. Research shows a 15–20% difference in results between practitioners examining the same skin. That gap stems from several variables: lighting conditions, time of day, practitioner fatigue, experience level, and available tools.
I have seen how these factors create inconsistent assessments. A single measurement under poor lighting can distort pigment evaluation. Without standardization, two experts may reach different conclusions about the same face. The table below summarizes how traditional methods compare with technological approaches.
| Criteria | Traditional Methods | Technological Methods |
|---|---|---|
| Repeatability | Variable | High |
| Subjectivity | High risk | Minimized |
| Accuracy | High (only with experienced practitioners) | Very high (calibrated device) |
The Rise of 3D Skin Analysis Technology
3D skin analysis changes the game by capturing both surface and subsurface data quantitatively. Devices like VISIA use calibrated imaging to measure wrinkle depth in micrometers, not vague terms like “fine lines.” This technology eliminates the guesswork. The industry has noticed. The market size reached USD 1 Billion in 2025 and is forecast to hit USD 2 Billion by 2035, growing at a CAGR of 9.3%.
I find this growth unsurprising. A 3D scan provides exact numbers for hydration, pigmentation, and texture. It creates a baseline you can track over time. Unlike traditional methods, which vary with each session, a calibrated device delivers the same result under the same conditions. That repeatability makes 3D skin analysis a more trustworthy tool for measuring change.
How 3D Skin Analysis Boosts Precision and Consistency
Quantitative Measurements vs. Qualitative Descriptions
Traditional analysis speaks in adjectives. A practitioner describes skin as “mildly dehydrated” or “moderately wrinkled.” Those words shift meaning from one examiner to the next. Digital devices replace adjectives with numbers. A 3D scan reports wrinkle depth in micrometers, redness in pixels squared, and pore size in pixels squared. I can compare those values across visits without guessing what “moderate” meant last time.
The table below shows what specific instruments measure and the units they use.
| 3D Analysis Instrument | Quantitative Metric | Unit |
|---|---|---|
| Primos Lite (Canfield Scientific, USA), 3D fringe projection | Wrinkle depth (3 values) | µm |
| Visia-CR (Canfield Scientific, USA) with ImagePro software | Redness areas | pix² |
| Visia-CR (Canfield Scientific, USA) with ImagePro software | Pore size | pix² |
A dermatologist reports that standardized numerical scoring systems, such as a Skin Pigmentation Score, deliver objective measurements. These scales eliminate human bias and keep imaging conditions consistent. Research backs this up. Traditional visual assessments like MASI are subjective and produce inter-clinician variability. Objective quantitative techniques offer reliability and reproducibility instead. One study found that a new imaging system using numerical scales correlated strongly with MASI scores and outperformed older devices. Numerical parameters let clinicians interpret both severity and involvement ratio, which reduces subjective judgment across evaluations.
Why Consistency Matters for Reliable Results
Precision means exact numbers. Consistency means the same scan produces the same result. Both matter for tracking change over time. A 3D system achieves 95% test-retest reliability, so repeated scans of the same person stay highly consistent. That consistency enables reliable before-and-after comparisons and automated progress tracking.
VISIA shows how tight this precision can be. Its wrinkle measurements vary by only about 3% for absolute scores across two captures. Percentile scores vary more, near 9%. The table below breaks down those figures.
| Measurement Type | Capture 1 | Capture 2 |
|---|---|---|
| Wrinkles – Absolute Scores | 3.36% | 3.4% |
| Wrinkles – Percentiles | 8.2% | 10.7% |
Traditional analysis cannot match that stability. Results shift with practitioner skill, room lighting, and fatigue. One examiner may see improvement where another sees none. A calibrated device removes those variables. The system also correlates with professional assessments at over 80%, which validates its accuracy against physician and device evaluations. I trust a tool that gives me the same answer twice. That repeatability is what makes 3D skin analysis more accurate for monitoring skin condition progression.
Detection Capabilities: Subsurface and Future Predictions
Surface vs. Subsurface Skin Conditions
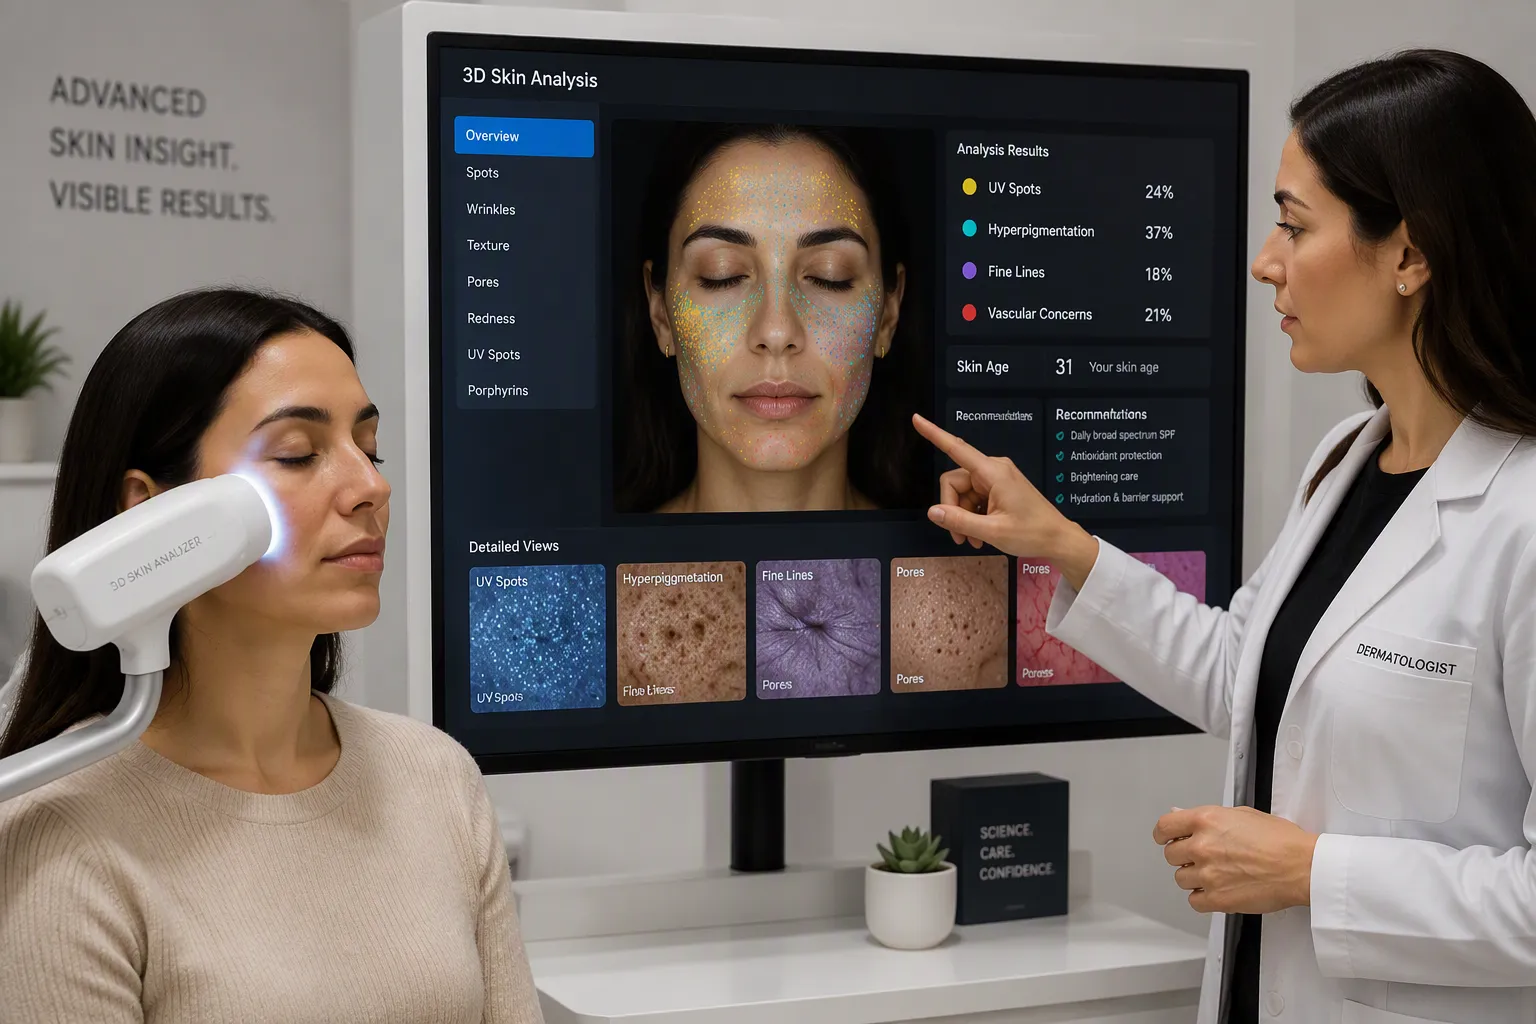
Many skin problems start below the surface before you can see them. A visual exam only shows what sits on top. That limit matters. Sun damage, pigmentation issues, and collagen loss often develop quietly for years. I can spot a rough patch or a dark spot with my eyes. I cannot see UV damage that has not surfaced yet.
3D skin analysis changes what I can detect. The table below shows what advanced imaging reveals beneath the skin.
| Subsurface condition detected | How 3D/advanced imaging reveals it |
|---|---|
| Sun damage and UV exposure not yet surfaced | UV light exposes sun damage and pigmentation beneath the surface |
| Hyperpigmentation and melasma beneath the skin | Polarized light penetrates the skin’s surface to reveal subsurface conditions |
| Fine lines and wrinkles in earliest stages | Cross-polarized light highlights texture, pores, and fine lines |
| Skin laxity and loss of elasticity | 3D analysis captures depth, texture, and contours |
| Enlarged pores and texture irregularities | High-resolution 3D imaging reveals microscopic-level detail |
| Redness, rosacea, and broken capillaries | Multi-wavelength imaging detects vascular concerns |
| Acne and bacterial concerns | Advanced skin imaging identifies bacterial concerns |
How 3D Skin Analysis Detects Subsurface Damage
Devices use several imaging modes to reach below the surface:
●Subsurface imaging reveals hidden damage beneath the skin’s surface, including sun damage that has not yet surfaced, underlying pigmentation issues, vascular conditions such as broken capillaries, and early signs of aging.
●UV photography captures fluorescence: epidermal melanin absorbs UV rays, highlighting subsurface sun damage as “UV spots.”
●UV fluorescence imaging detects porphyrins, which glow under specific UV wavelengths, indicating bacterial activity that may lead to acne or inflammation.
●Different UV spectrums allow targeted evaluation: shorter wavelengths emphasize superficial pigmentation, while longer wavelengths penetrate deeper to reveal chronic sun damage or vascular concerns.
Ultraviolet (UV) dermoscopy: functions like an amplified Wood’s lamp, emitting UV light within the 360–390 nm range and generating fluorescence in visualized structures to assist in diagnosing various disorders. It can provide valuable additional information and clarity when dermoscopy and Wood’s lamp examination are inconclusive, though its higher cost compared to conventional dermoscopes currently restricts widespread clinical use.
Polarized spectral imaging: involves the use of polarized light to capture images of the skin. By controlling the polarization of light, this technique can reveal information about skin texture, sub-surface structures, and the presence of certain skin conditions.
The VISIA complexion analysis system records and measures both surface and subsurface skin conditions using three lighting modes: standard, cross-polarized, and UV lighting. According to the manufacturer, UV photography delivers the most complete data set for sun damage assessment and analysis, and includes UV fluorescence imaging that reveals porphyrins.
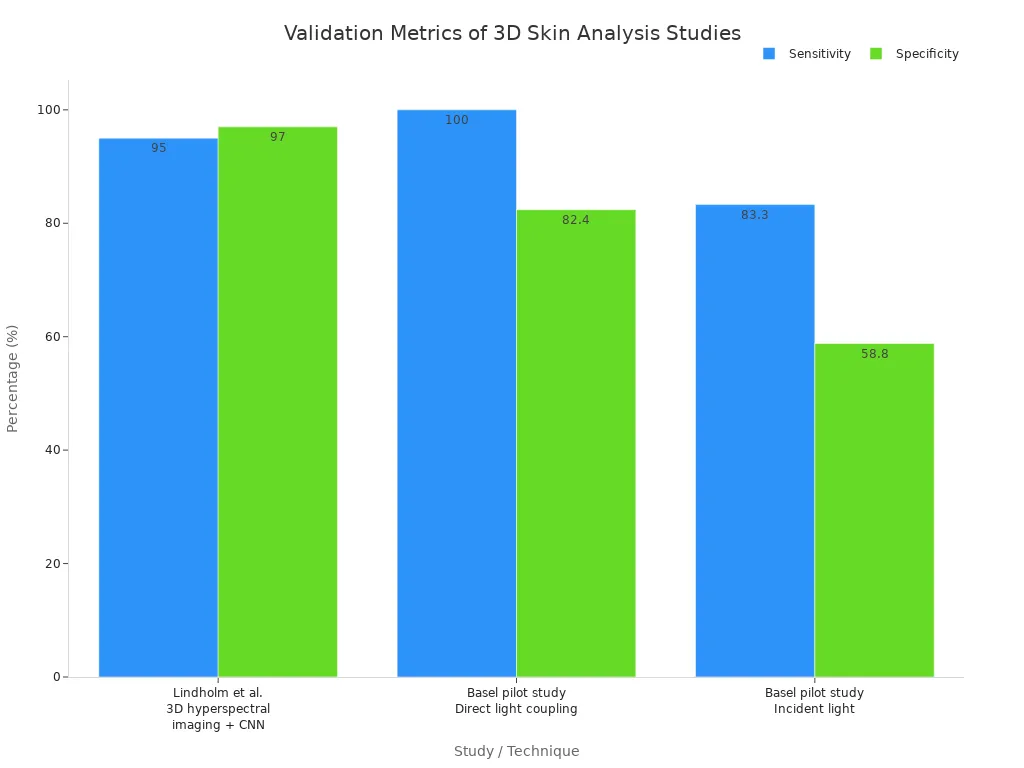
Traditional analysis cannot predict future aging. A 3D scan can model progressive changes. Studies validate this detection power. Lindholm et al. used 3D hyperspectral imaging with a CNN on 20 pigmented skin lesions and reached 95% sensitivity and 97% specificity with majority voting. A Basel pilot study tested direct illumination multispectral imaging on 27 suspicious pigmented lesions from 23 patients. Direct light coupling produced 100% sensitivity and 82.4% specificity. Incident light produced 83.3% sensitivity and 58.8% specificity.
What Studies Show About Accuracy Rates
Comparing Diagnostic Accuracy: 3D vs. Traditional
Numbers tell the clearest story here. AI-based 3D systems have demonstrated high accuracy; for example, a study using 3D hyperspectral imaging achieved 95% sensitivity and 97% specificity for detecting pigmented skin lesions. Manual analysis by trained practitioners shows a 15–20% difference in results between practitioners. This matters for anyone tracking treatment progress or catching problems early.
I find the false positive data equally revealing. A 3D system may flag lesions that turn out benign upon biopsy, and some users may receive false positive alerts that require follow-up. Those users may need more follow-up visits than people who received professional screening. Traditional dermatologist examination serves as the baseline for that comparison. The table below summarizes these findings.
| Metric | 3D Skin Analysis / Apps | Traditional Dermatologist Examination |
|---|---|---|
| False positive rate (benign upon biopsy) | — | Not provided |
| False positive alerts requiring follow-up | — | Not provided |
| Unnecessary follow-up visits | — | Baseline (reference for comparison) |
These figures do not mean 3D technology fails. They show where human oversight still adds value. A device can flag a suspicious spot. A dermatologist decides whether that spot needs a biopsy. The combination of digital detection and human judgment produces the best outcomes.
Real-World Evidence from Devices Like VISIA
Scientific investigation of VISIA confirms its high precision for skin analysis. Researchers have tested this device across multiple clinical settings. The results consistently show strong correlation with professional assessments. One validation study found over 80% correlation between VISIA measurements and physician evaluations. That level of agreement supports using the device as a reliable diagnostic aid.
Test-retest reliability of 95% stands as the strongest evidence for consistency. This figure means a single person scanned twice under identical conditions receives nearly identical results. I can track a patient’s wrinkle depth or pigmentation changes across months without worrying about measurement drift. Traditional visual grading cannot match that stability. Two dermatologists examining the same patient may disagree. One VISIA scan produces the same numbers every time.
The 3D skin analysis market reflects this confidence. The industry reached USD 1 Billion in 2025 and is forecast to hit USD 2 Billion by 2035. That growth signals widespread adoption across dermatology clinics, med spas, and research institutions. Practitioners invest in this technology because the data supports its accuracy.
I see one important caveat. Accuracy rates depend on proper device calibration and trained operators. A poorly maintained VISIA system or an untrained technician can produce unreliable results. The technology delivers precision when used correctly. The studies assume that correct use. Clinics that follow manufacturer guidelines and maintain their equipment achieve the accuracy rates reported in the literature.
The evidence points to a clear conclusion. Digital systems outperform manual analysis for detecting pigmented lesions and subsurface skin conditions. They provide consistent, repeatable measurements that humans cannot match. The false positive data remind me that technology works best as a complement to professional expertise, not a replacement.
Factors That Affect Reliability of Skin Analysis
Technology Quality and Device Calibration
No machine delivers perfect results without proper setup. These systems require regular calibration to maintain accuracy. I have seen how a misaligned camera or outdated software can produce unreliable measurements. The device itself must work correctly for the data to mean anything.
Several device-related factors can degrade accuracy. Compatibility issues with existing clinical IT infrastructure hinder seamless integration. Technical failures undermine clinical confidence and workflow efficiency. Specialized training requires sufficient operator skill. Operational errors directly affect diagnostic accuracy. Lack of standardized protocols creates inconsistent data handling. The table below summarizes these factors.
| Device-Related Factor | Impact on Diagnostic Accuracy |
|---|---|
| Compatibility issues with existing IT infrastructure | Hinders seamless integration, potentially degrading result reliability |
| Need for specialized training and technical expertise | Insufficient operator skill can lead to inaccurate analysis |
| Risk of operational errors | Directly affects diagnostic accuracy |
| Fragmentation due to lack of standardized protocols | Inconsistent data handling reduces accuracy |
| Technical failures | Undermine clinical confidence and workflow efficiency, affecting accuracy |
Traditional methods face different problems. Lighting conditions shift throughout the day. A practitioner working late may miss subtle signs. Fatigue affects judgment. Experience level changes how one person reads the same skin. These variables make traditional analysis less consistent.
The Role of Practitioner Expertise
Technology removes many human errors, but it does not remove all of them. An untrained operator can still produce poor results with a digital analysis device. I know that specialized training remains essential. The operator must position the patient correctly. They must select the right imaging mode. They must interpret the data within clinical context.
Traditional analysis depends almost entirely on practitioner expertise. A dermatologist with twenty years of experience reads skin differently than a new esthetician. Two practitioners examining the same patient may disagree on severity. Research shows a 15–20% difference between practitioners using traditional methods.
I conclude that both methods have vulnerabilities. 3D skin analysis reduces human error through objective measurements and repeatable scans. It is not infallible. Proper device maintenance and operator training remain crucial for accuracy. When clinics follow manufacturer guidelines, the technology delivers reliable results. When they skip those steps, accuracy drops. The best approach combines digital precision with professional judgment.
I trust 3D skin analysis for higher accuracy. It delivers objective, quantitative data and detects subsurface damage that visual exams miss. The evidence supports this: a 3D hyperspectral imaging system achieved 95% sensitivity and 97% specificity for pigmented skin lesions, and test-retest reliability sits at 95%.
Traditional methods still work well for quick initial assessments or when advanced technology is unavailable. For precision, consistency, and future-oriented skin care, digital scanning is the more trustworthy option.
As AI and imaging improve, the accuracy gap will only widen. Consider your specific needs when choosing a method. If you track change over time, the data points clearly toward digital tools.
FAQ
Is 3D skin analysis more accurate than a dermatologist’s eye?
Yes, for measurable features. 3D imaging achieves high repeatability and over 80% correlation with professional assessments, while manual assessments show a 15–20% difference between practitioners. I still value a dermatologist’s judgment for diagnosis and biopsy decisions. The strongest results come from pairing digital detection with professional expertise.
Can I trust the same 3D scan to give the same result twice?
Yes. A 3D system holds 95% test-retest reliability. VISIA wrinkle measurements vary by only about 3% for absolute scores across two captures. That stability lets me track change over months without worrying about measurement drift. Traditional visual grading cannot match this repeatability.
Does 3D skin analysis catch damage I cannot see yet?
Yes. UV and polarized imaging reveal sun damage, subsurface pigmentation, and vascular concerns before they surface. Standard visual exams only show what sits on top of the skin. This early detection helps me address problems before they become visible.
What makes traditional skin analysis less reliable?
Practitioner skill, lighting, and fatigue all shift results. Research shows a 15–20% difference between practitioners examining the same skin. Two experts may disagree on severity. A calibrated device removes those variables and delivers consistent numbers instead.
Do 3D devices ever produce wrong results?
Yes, sometimes. Some AI-flagged lesions may turn out benign upon biopsy, and some users may receive false positive alerts. Those users may need more follow-up visits. I treat 3D scans as a screening aid, not a final diagnosis. Proper calibration and trained operators keep accuracy high.
Post time: Sep-28-2026


