


A standard scale only shows weight. It cannot tell you if you’re losing fat or muscle. A Body Composition Analyzer reveals far more. It can measure body fat percentage, skeletal muscle mass, visceral fat level, total body water, basal metabolic rate, and segmental lean analysis. Advanced models even estimate bone mass. This article explains each metric, how the device works, and how to apply this data. You’ll know exactly what to look for on your next report.
Key Takeaways
●A body composition analyzer shows fat, muscle, and bone percentages, not just weight.
●Track changes over time with consistent conditions to see real progress.
●Use the data to adjust your fitness plan and improve your health.
Core Metrics of a Body Composition Analyzer
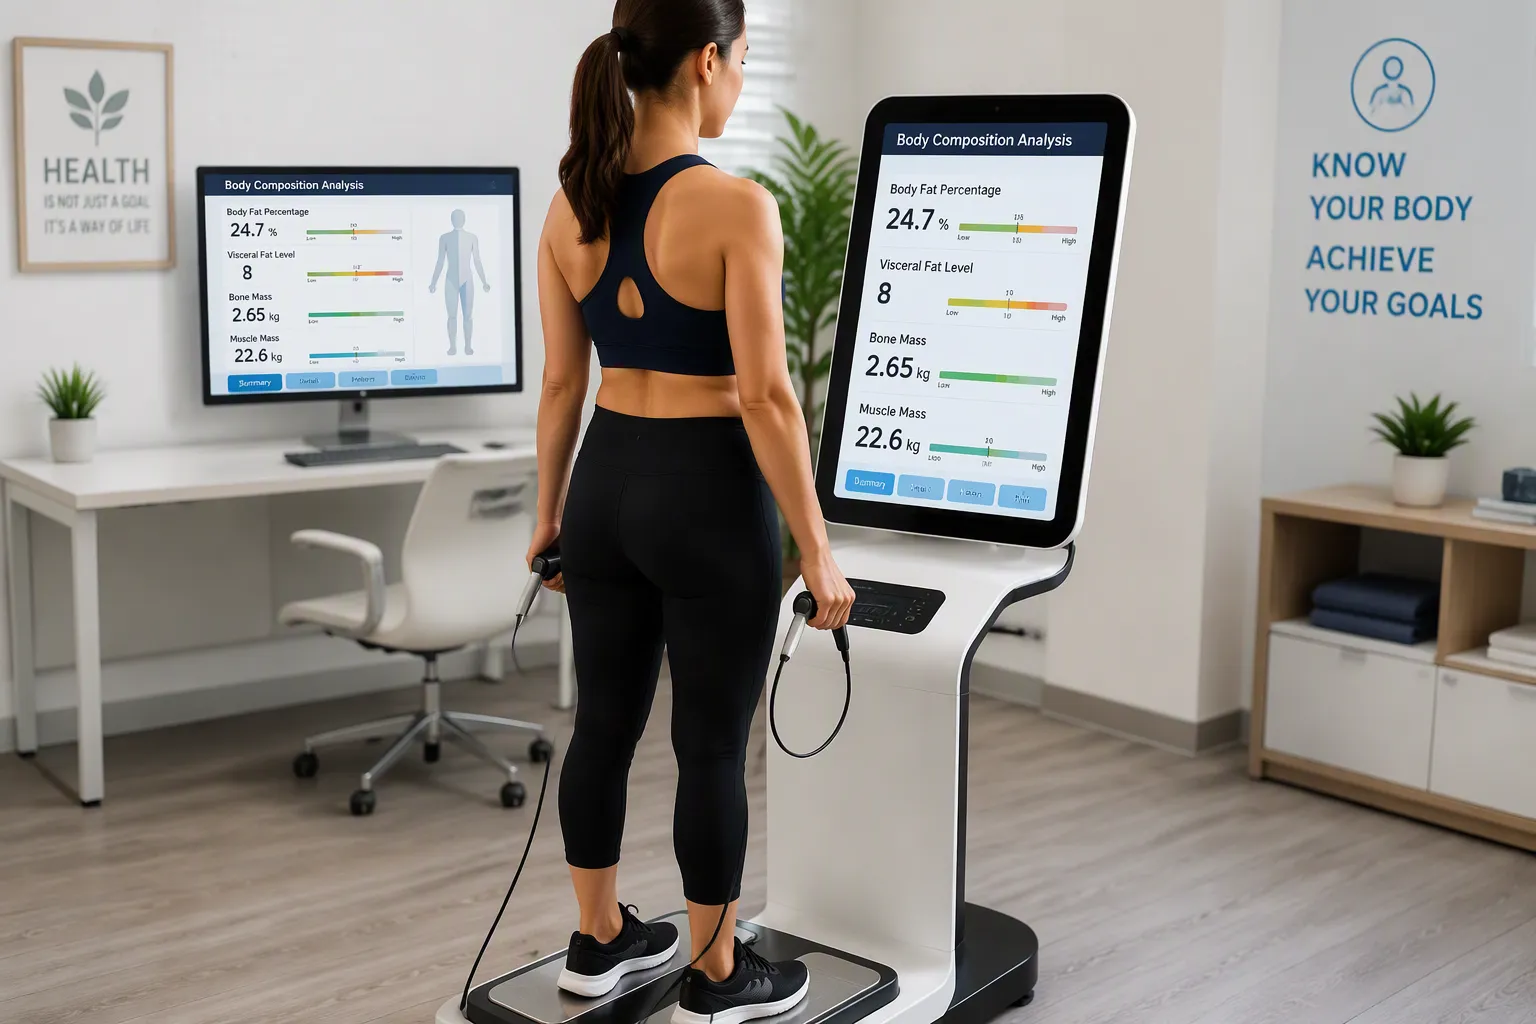
When I first reviewed a body composition report, the sheer number of numbers felt overwhelming. But each metric tells a specific story about your health. Let me walk you through the essential measurements and what they mean for your body.
Body Fat, Visceral Fat, and Bone Mass
Body fat percentage represents the fraction of your total weight that consists of fat tissue. According to the American Council on Exercise, healthy ranges for women sit between 21-24% for the “Fitness” category and 25-31% for “Acceptable.” For men, those ranges are 14-17% and 18-24% respectively. This number matters because it distinguishes between weight loss from fat versus muscle loss.
Visceral fat deserves special attention. Unlike subcutaneous fat that sits just beneath your skin, visceral fat wraps around your internal organs. Research shows this type of fat releases free fatty acids that interfere with insulin function, raising your risk for type 2 diabetes and cardiovascular disease. One study found that people in the highest quartile of visceral fat had odds ratios of 7.57 for prediabetes and diabetes in women, and 5.41 in men. This fat type also triggers systemic inflammation and hypertension.
Bone mass measurement helps detect osteopenia and osteoporosis early. A T-score above -1.0 indicates normal density, while scores between -1.0 and -2.5 signal osteopenia risk. Below -2.5 suggests osteoporosis. Since osteoporosis progresses silently until a fracture occurs, catching bone loss early through a Body Composition Analyzer enables timely intervention with calcium, vitamin D, and exercise.
Muscle Mass and Segmental Lean Analysis
Skeletal muscle mass represents the muscle attached to your bones. This metric strongly predicts your metabolism and long-term mobility. For women, average muscle mass ranges from 31-33% of body weight between ages 18-35, declining to 27-30% by ages 56-75. The connection to metabolism is direct: muscle tissue requires substantial energy to maintain, so higher muscle mass raises your basal metabolic rate. One peer-reviewed study confirmed a robust positive correlation between muscle mass and resting metabolic rate, while fat mass showed no significant impact.
Segmental lean analysis breaks down muscle and fat distribution across five body segments: left arm, right arm, trunk, left leg, and right leg. This feature reveals imbalances that whole-body measurements miss. Many sedentary workers develop strong upper bodies but weak lower bodies. Right-left asymmetries also appear commonly in arms and legs. Research indicates that side-to-side lean mass differences above 10% are meaningful, and above 15% warrant targeted intervention. Corrective training using unilateral exercises can address these imbalances. Balanced muscle development distributes forces evenly across joints, reducing injury risk. For example, strong quadriceps paired with weak hamstrings predispose the knee to injury.
A quality Body Composition Analyzer provides all these metrics in one session, giving you a complete picture that a standard scale simply cannot offer.
Metabolism, Hydration, and Accuracy Factors
Basal Metabolic Rate and Total Body Water
Your basal metabolic rate (BMR) represents the calories your body burns at complete rest to maintain vital functions like breathing and circulation. A Body Composition Analyzer estimates this number indirectly. The device measures electrical impedance to estimate total body water, then uses that figure to determine fat-free mass. Since fat-free mass correlates strongly with BMR, this estimation method works reasonably well. However, I should note the limitations. One study comparing estimation methods found that BIA overestimated BMR by an average of 336 kcal/day compared to indirect calorimetry, with only 11% of readings falling within ±10% of the gold-standard measurement. The Harris-Benedict equation performed similarly, overestimating by 329 kcal/day. These numbers tell me that BIA provides a useful ballpark, not a precise metabolic measurement.
Total body water (TBW) represents the total fluid volume in your body. Normal ranges sit between 50-65% for men and 45-60% for women. This metric matters beyond simple hydration tracking. Intracellular water—the fluid inside your cells—protects muscle from functional decline. Better cell hydration corresponds to greater muscle mass. The amount of intracellular water per unit of lean mass even serves as an indicator of muscle quality, positively related to strength and negatively related to frailty risk. When I see a client’s TBW dropping, I know their muscle quality may suffer too.
How BIA Technology Works and Preparation Tips
Bioelectrical impedance analysis works by sending a low-level electrical current through your body. Four electrodes attach—one on each hand and one on each foot. The device measures resistance to that current flow. Lean tissues conduct electricity well because they contain high water content. Bone and adipose tissue act as poor conductors. From the measured resistance, the device estimates total body water, then calculates fat-free mass using the assumption that 73% of fat-free mass consists of water.
Several factors influence accuracy. Body tissue temperature, water content, and electrolyte concentration all affect electrical conductivity. Abnormal hydration status creates significant problems. Research shows that BIA becomes unsuitable for assessing athletes with hyperhydration or hypohydration, as small fluid shifts can be misinterpreted as changes in body fat. The hydration fraction of fat-free mass varies from 73% to over 77% in individuals with higher body fat, directly skewing results.
While BIA has been criticized for poor accuracy in subjects with significantly altered hydration levels, it can still estimate total body water in normally hydrated individuals, such as athletes.
For reliable tracking, preparation matters. I recommend these steps before each scan:
●Fast for 8-12 hours before testing
●Avoid strenuous exercise for 12-24 hours prior
●Measure at the same time each day, ideally in the morning
●Avoid alcohol for 24 hours before the test
●Maintain consistent hydration status
●Use the same device consistently
BIA carries a typical error margin of ±3-5% for body fat percentage, while DEXA achieves ±0.8%. Experts consider DEXA the gold standard. However, BIA excels at tracking trends over time when you control conditions carefully. The key insight: use your Body Composition Analyzer consistently, under identical conditions, and focus on directional changes rather than absolute numbers.
A Body Composition Analyzer reveals far more than weight alone. I’ve seen how tracking changes over time transforms fitness journeys. Get your baseline measurement first. Schedule retests according to your goals:
| Goal | Recommended Frequency |
|---|---|
| Active fat loss | Every 8 to 12 weeks |
| Muscle gain | Every 12 to 16 weeks |
| Maintenance | Every 6 to 12 months |
Monthly scans rarely show meaningful changes. Know your numbers. Make informed decisions.
FAQ
How often should I measure my body composition?
I recommend tracking every 4-6 weeks for most people. This timeframe gives your body enough time to show meaningful changes. Monthly scans rarely reveal significant shifts in muscle or fat.
Can I use a body composition analyzer at home?
Yes, many home devices use the same BIA technology. I suggest choosing a model with foot and hand electrodes for better accuracy. Consistency matters more than the device’s precision.
Why do my results vary between measurements?
Hydration levels, food intake, and time of day all affect readings. I always test in the morning, before eating, and after using the restroom. This routine keeps my measurements consistent and reliable.
Post time: Sep-01-2026


