


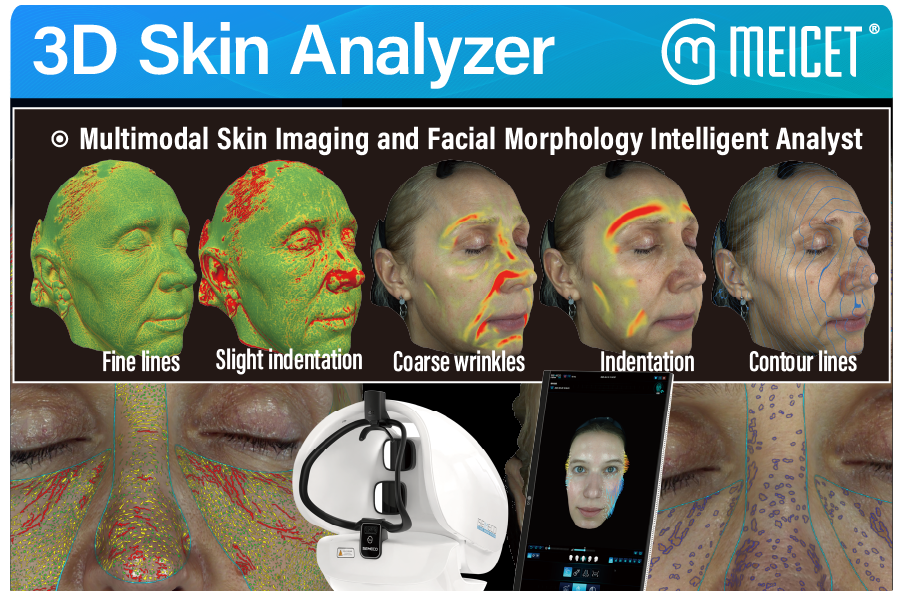
- • Surface topography parameters require 3D structured light: wrinkle depth, pore size, and volume changes cannot be measured from 2D images alone.
- • The D9’s 8-dimension aging model covers forehead lines, glabellar lines, crow’s feet, periorbital lines, laugh lines, marionette lines, corner of mouth lines, and brown spots, each graded on a defined scale.
- • Spectral modes determine subsurface parameter access: UV reveals pigmentation depth and porphyrins; cross-polarized light shows vascular redness and inflammation.
- • Biophysical parameters (hydration, sebum) are reported by MEICET as measurable, though the underlying methodology should be verified during demonstration.
- • Volume and contour parameters are quantified with 0.1ml precision, enabling filler and structural change tracking.
Surface topography parameters describe the physical shape of the skin—depressions, elevations, and texture. These require true structured-light depth capture.
The ISEMECO D9 reports 0.2mm modeling accuracy with binocular grating structured light, and its automated scanning captures a 180° full-face image in a single shot. The device’s software analyzes:
- Wrinkle depth and severity: the 8-dimension aging model grades forehead lines, glabellar lines, crow’s feet, periorbital lines, laugh lines, marionette lines, and corner of mouth lines.
- Pore size classification: the D9 MAX brochure describes pore analysis divided into large, medium, and small categories with quantified data.
- Skin texture and roughness: MEICET states the system captures “3D texture, curvature, 3D structure” and analyzes “facial roughness”.
- Volume and contour changes: the D9 reports 0.1ml precision for volume difference calculation, enabling filler outcome tracking and facial symmetry assessment.
- Facial proportions: the D9 includes Horizontal Thirds and Vertical Fifths functions for contour morphology evaluation.
These parameters are the foundation of the device’s clinical utility. A 2D analyzer can show that a wrinkle appears dark; a 3D analyzer measures that the wrinkle is 0.4mm deep.
Pigmentation parameters describe where melanin accumulates and at what depth. The D9’s spectral modes enable this assessment.
UV imaging excites porphyrins and highlights pigmentation beneath the surface—sun damage that visible light cannot reveal. Brown area mapping quantifies pigmentation severity.
The D9 MAX brochure describes pigment analysis that divides brown spots into mild, moderate, and severe categories, calculating symptom count, area, and area percentage for each level. This granularity allows a clinician to track whether a treatment reduced brown spot area from 15% to 10% of the cheek surface.
Melanin content is reported by MEICET as a measurable parameter, described as helping users “understand their skin pigmentation, providing a scientific basis for whitening skin care”. The D9’s brown spectrum images and heat maps are specifically designed for this assessment.
Vascular parameters describe redness, inflammation, and sensitivity—conditions that often sit beneath the skin surface and require cross-polarized or red-zone imaging.
The D9’s red-zone imaging is designed to locate deep inflammation and assess skin barrier health. The software classifies sensitivity symptoms (inflammation, redness, pimples, acne) into mild, moderate, and severe levels, with quantified symptom count, area, and area percentage.
A clinical presentation by Dr. Shi at the 2024 MEC conference demonstrated the D9’s use of near-infrared, red-zone, brown-zone, and UV images (11 high-definition 3D images total) for “visual evidence of skin health” and “direct basis for pathological diagnosis of sensitivity and inflammation”.
MEICET’s product page describes sensitive analysis as covering “inflammation, redness, pimples, acne” across the three severity levels. This parameter category is particularly relevant for clinics treating rosacea, acne, or sensitive skin.
Biophysical parameters describe skin condition at the physiological level—moisture content, oil production, and firmness.
MEICET states the D9 can “accurately analyze the moisture content of the skin” (noting healthy skin ranges from 10% to 30%), detect “oil production,” and assess “elasticity” through its spectral analysis. The D9 MAX materials also reference elasticity and hydration tracking as part of the device’s parameter set.
The D9’s hydration and sebum measurements are derived from spectral image analysis, not from contact-based corneometry or sebumetry sensors. The manufacturer should be asked to explain the validation methodology for these inferred parameters.
| Parameter Category | Specific Parameters | D9 Measurement Method | Verification Question |
|---|---|---|---|
| Surface topography | Wrinkle depth, pore size, texture, volume/contour | Binocular grating structured light (0.2mm accuracy) | Live scan of reference object |
| Aging (8 dimensions) | Forehead, glabellar, crow’s feet, periorbital, laugh lines, marionette, mouth corner, brown spots | AI grading of 3D + spectral data | Performance data by Fitzpatrick type |
| Pigmentation | Brown spots, melanin, UV damage | UV and brown-spectrum imaging; mild/moderate/severe grading | Ground truth for severity classification |
| Vascular/sensitivity | Redness, inflammation, acne, sensitivity | Cross-polarized and red-zone imaging; 3-level grading | Clinical validation of sensitivity grades |
| Biophysical | Hydration, sebum, elasticity | Spectral inference (methodology not detailed) | Calibration against reference instruments |
| Structural | Facial proportions, symmetry, contour | Horizontal Thirds, Vertical Fifths, 0.1ml volume precision | Repeatability on same subject |
Post time: Oct-23-2026


