


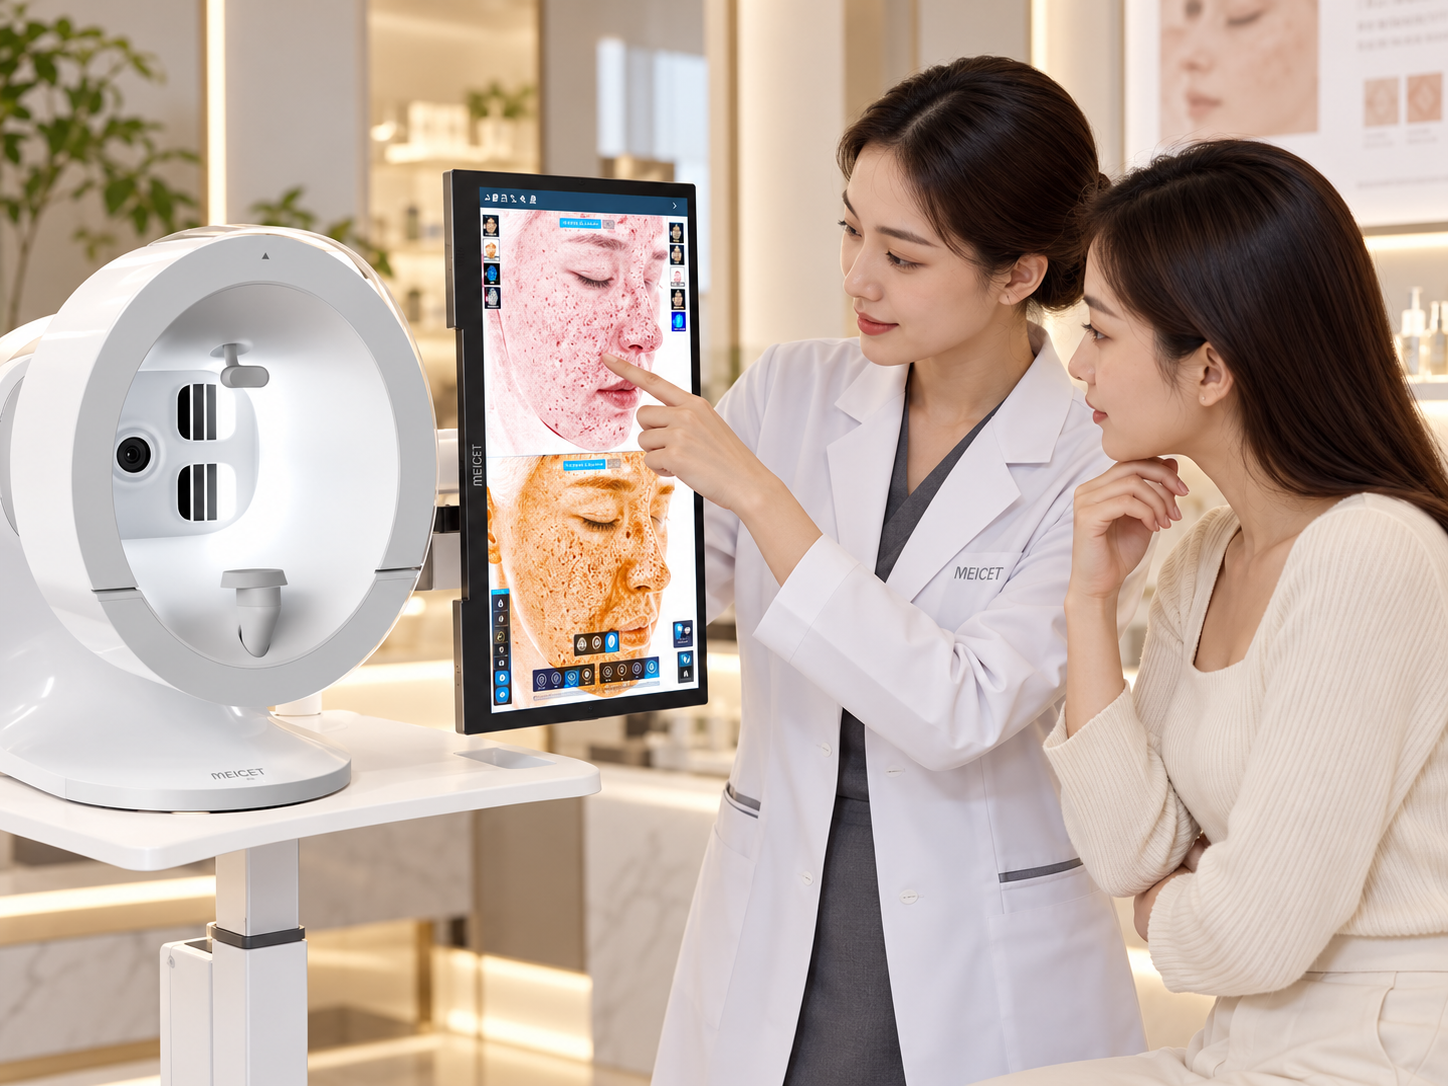
A smart skin analyzer is a multi-spectral imaging system that combines high-resolution cameras, controlled lighting, and AI-driven software to quantify skin conditions—pigmentation, wrinkles, pores, vascularity, and sensitivity—that are difficult to assess consistently with the naked eye. The device captures images under different light spectra (RGB, cross-polarized, UV), reconstructs a digital skin map, and applies trained algorithms to grade severity and generate measurable reports. The ISEMECO 3D D9, for example, uses binocular structured light to build a 180-degree 3D facial model with reported modeling accuracy of 0.2 mm and a 42-megapixel full-face image capture . The system does not replace clinical judgment; it converts subjective visual assessment into reproducible data points that support treatment planning and progress tracking.
Smart skin analyzers work by combining controlled illumination with image analysis. Different light spectra reveal different skin layers and conditions: UV exposes sun damage and porphyrins, cross-polarized light reduces surface glare to show subsurface vascularity, and RGB provides surface texture and color reference.
3D capability distinguishes professional systems from simple cameras. The D9 captures a full 180° facial model in a single shot using binocular structured light, enabling volume and contour assessment in addition to surface skin analysis .
AI does not diagnose; it quantifies and grades. The system applies trained algorithms to classify severity (mild, moderate, severe) and generate reports, but the output is a decision-support tool, not a medical diagnosis.
The D9’s stated specifications include a 42-megapixel full-face sensor, 0.2 mm 3D modeling accuracy, four spectral modes (RGB, cross-polarized, parallel-polarized, UV), and detection of 11+ skin parameters .
A smart skin analyzer’s diagnostic value comes from its ability to image the skin under spectra that isolate specific chromophores and structures. Under standard visible light, surface redness, pigmentation, and texture overlap. By switching light sources, the system separates these signals.
| Spectral Mode | What It Reveals | Why It Matters |
|---|---|---|
| RGB (visible) | Surface texture, pores, fine lines, color variation | Baseline visual record for comparison |
| Cross-polarized | Subsurface vascularity, redness, inflammation | Reduces surface glare to show hemoglobin and deeper erythema |
| Parallel-polarized | Surface reflection, sebum, texture | Highlights shine and skin surface topography |
| UV (ultraviolet) | Sun damage, porphyrins (bacterial byproducts), deep pigmentation | Reveals photodamage and acne-associated bacteria not visible under normal light |
The D9 specification lists RGB, cross-polarized, parallel-polarized, and UV as its spectral modes, using solid-state LED illumination . This combination allows the software to generate separate analysis maps for pigmentation, vascularity, and surface texture from the same capture session.
A conventional skin analyzer produces a 2D photograph. The D9 uses binocular grating structured light to project a known pattern onto the face and analyze how the pattern deforms over contours. This deformation is mathematically converted into a depth map, producing a 3D model of the face.
The D9’s stated 3D modeling accuracy is 0.2 mm, and the system captures a 180° full-face image in a single shot without requiring the subject to reposition . This matters for two reasons: it reduces operator variability (the same capture protocol is used every time), and it enables volumetric comparison—measuring whether a treatment changed facial volume or contour, not just surface appearance.
The system guides the operator through a fixed capture protocol: subject positioning, lighting conditions, and image acquisition. The D9 uses a 42-megapixel CMOS sensor with a 40° × 40° field of view . A single button press initiates the capture sequence across all spectral modes.
The software aligns the spectral images to a common coordinate system and segments the face into anatomical regions—forehead, periorbital area, cheeks, nasolabial folds, and chin. The D9’s AI face recognition algorithm identifies the T-zone, U-zone, and O-zone for region-specific analysis.
Algorithms trained on large image datasets identify and quantify specific features:
- Wrinkles: The D9 evaluates 8 aging dimensions, including forehead lines, glabellar lines, crow’s feet, periorbital lines, laugh lines, marionette lines, and brown spots . Each feature is graded on a severity scale (mild, moderate, severe) and assigned a numeric score.
- Pigmentation and sensitivity: Brown spots and sensitive areas are classified into 3 severity levels, with detection area and percentage provided for each level .
- Skin type classification: The system incorporates Fitzpatrick skin type (I–VI) to reduce misclassification across different skin tones .
The output is a structured report containing the original spectral images, annotated analysis maps (e.g., pigmentation distribution, redness zones), severity scores, and a comparison with previous visits if available. The D9 supports custom report generation with clinic branding, PDF export, and remote viewing on mobile devices .
The D9’s published specifications and feature descriptions identify the following analysis categories:
| Analysis Category | What the System Reports | Data Output |
|---|---|---|
| Aging assessment | 8 dimensions (forehead, glabella, crow’s feet, periorbital, laugh lines, marionette, mouth corners, brown spots) | Severity grade per dimension; overall aging ranking |
| Pigmentation | Brown spots, hyperpigmentation, UV-induced damage | Area (mm² or %), severity level (mild/moderate/severe) |
| Sensitivity/redness | Erythema zones, vascularity | Area, severity level, distribution map |
| Pores and texture | Pore size and density, surface roughness | Visual map with quantified regions |
| 3D facial morphology | Contour, symmetry, volume | 0.2 mm resolution 3D model; horizontal thirds and vertical fifths assessment |
| Skin type | Fitzpatrick classification (I–VI) | Classification output to contextualize other measurements |
The system also includes a before/after comparison function that displays volume changes with warm/cool color coding, and an aging prediction feature that visualizes the face at future ages (20–80 years) based on current parameters .
A smart skin analyzer produces measurements and visualizations. It does not diagnose disease. A pigmentation map showing concentrated melanin in a region does not differentiate between melasma, post-inflammatory hyperpigmentation, and lentigines—that distinction requires clinical examination and history. The D9 and similar systems are marketed as aesthetic consultation and treatment planning tools, not as replacements for dermatological diagnosis.
Even with standardized capture, factors affect measurement consistency: skin hydration at the time of capture, recent sun exposure, makeup residue, and subject positioning within the field of view. The D9’s single-shot 180° capture reduces positioning variability compared to systems that require multiple captures, but it does not eliminate the need for a consistent pre-capture protocol (e.g., cleansing, controlled temperature, consistent timing relative to treatments).
The severity grades and scores are only useful when interpreted in clinical context. A “moderate” wrinkle grade on a 55-year-old patient with significant photodamage has different treatment implications than the same grade on a 30-year-old. The system’s value is in tracking change over time and standardizing communication—not in replacing the practitioner’s judgment.
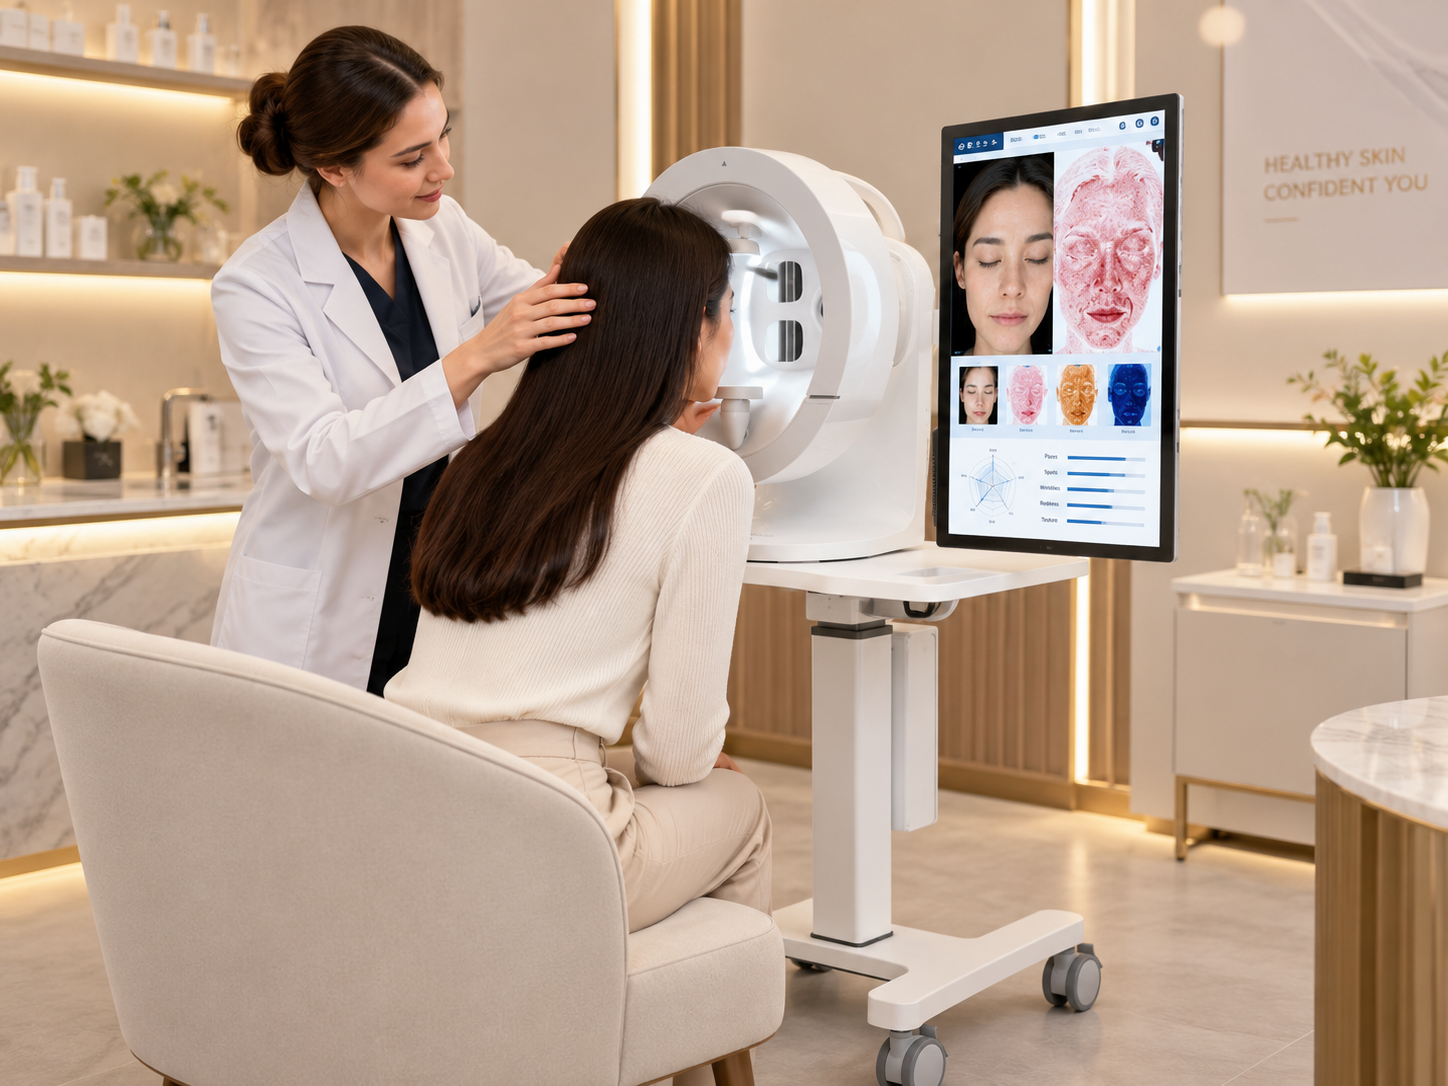
A magnifying lamp provides visual magnification under a single light source. A smart skin analyzer captures images under multiple controlled spectra, applies algorithms to quantify features (pigmentation area, wrinkle depth, pore density), and generates a documented report. The analyzer’s value is measurement and reproducibility, not magnification.
The D9 incorporates Fitzpatrick skin type classification (I–VI) into its analysis framework, which is intended to reduce misclassification across tones . However, the accuracy of any algorithm depends on the diversity of its training data. Buyers should request information about the Fitzpatrick distribution of the training dataset and, ideally, test the system on representative skin tones before purchase.
The D9 captures a full 180° 3D image in a single shot . The total session time—including subject preparation, capture, and report review—typically ranges from a few minutes to 10–15 minutes depending on the number of analysis modules activated and whether comparison reports are generated.
Yes. The system supports before/after 3D comparison with volume change visualization, and provides quantified measurements (area, percentage, severity grade) that can be compared across visits . This is the primary clinical value of the system: demonstrating change with data rather than subjective impression.
The product listings state CE and RoHS certification . Potential buyers should verify the specific certificate and its scope directly with the supplier, and confirm whether the certification applies to the exact model being purchased.
Not necessarily. A 2D multi-spectral analyzer provides surface pigmentation, vascularity, and texture analysis at lower cost. The 3D capability becomes valuable when the practice involves volume assessment, contour evaluation, or injectable treatments—where the third dimension provides information that a flat image cannot capture .
No. The D9 is an imaging and measurement tool. It does not diagnose skin disease, and its outputs are visualizations and severity grades based on trained algorithms. Clinical examination, history, and—where indicated—biopsy remain the standard for diagnosis.
Post time: Nov-09-2026


